



The Discipline Arrived.
The Monetization Didn't.
Across a decade of our benchmarks, B2B CX programs got faster, better aligned, better staffed, and adopted AI en masse. But the share who can put a currency figure on their work has been flat since 2017. This report shows the gap, proves the payoff for the few who close it, and gives you the question set to find out where you stand.
State Of The
NPS Industry
Ten years ago CustomerGauge started measuring this industry because nobody else would. Sixty-five thousand data points later, the picture is clearer than ever: two different CX businesses living side by side.
The first CX business is unmistakably getting better. Close-the-loop targets went from rare (38% in 2021) to normal (62% today), and the 48-hour turnaround is close to standard practice. AI went from not-a-question in 2021 to majority adoption today, and digital pop-ups overtook email this June. On our own platform, median response rates are climbing while the wider market complains they're falling. The playbook works. When programs run it, customers respond. Literally.
The second CX business has not moved in a decade. In 2017, a third of programs had linked customer feedback to revenue. Today: 39%. The share with a quantified figure on their financial impact is 4.5%, lower than when we started asking. Two-thirds don't track referrals or expansion revenue; sixty percent can't say what share of their revenue has been heard from. This is the monetization gap, and it is no longer a maturity problem; it is a choice. One of our clients can now show, against audited revenue, that a point of NPS is worth a point of three-year growth. The proof is in. The excuses are not.
What Needs to Happen
- →Link the program to revenue — start with retention
- →Set targets on response and loop-closing — free, and replicated across three editions
- →Treat revenue coverage as a board metric
- →Push AI past reading feedback into acting on it
- →Benchmark against measured reality, not press releases
The discipline arrived. The monetization didn't. CX businesses that close that gap stop being the first budget cut in a hard year, and start being the reason the hard year isn't.
One Survey, Three Lenses,
Ten Thousand Data Points
In mid-2026, 340 B2B CX programs answered 47 questions about how they measure, act, monetize, and use AI — more than 10,000 data points in all. We read those answers against two other lenses we uniquely hold. Where the three lenses disagree, the truth is usually in the gap. This report is about those gaps.
AI Is Now
the Mainstream
of B2B CX programs already use or pilot AI, and 78% will be on the path by mid-2027. In 2021 our benchmark survey didn't ask about AI. By 2025, 88% were "exploring" but only 2% had integrated it — pilot purgatory. One year later, adoption is the norm and inaction is the outlier.
Where Programs Stand on AI · 2026
Hover a bar for the detail behind it
AI Is Reading Feedback. It Isn't Acting on It Yet.
are actively considering AI voice feedback — the frontier everyone is circling. Reading (black) is solved; acting (coral) is wide open.
The Shocking Lack
of Monetization
Only 4.5% of programs have quantified the financial impact of CX. The majority, 74%, cannot state the financial impact of their program on revenue at all. This is a shameful statistic that industry professionals must take seriously. It means that when a customer churns, the CX team likely didn't predict it. Worse, they cannot show what value they bring to the business.
In normal times this would be worrying. In today's war economy, it makes CX look like a vanity project that can easily be cut. This is a huge warning sign for the industry. And in ten years of running these benchmarks, we have not seen this metric get better.
What Programs Don't Measure · Coral = the Share Flying Blind
Hover a bar for the detail behind it
Despite the Lack of Programs Really Proving It, the "Partial Linkers" Have Grown by 42%
partially linked · growing +42%
2021 · "positive implications, not calculated" → 2026 · "partially linked / some linkage"
proven · stuck in single digits
2021 · "calculated a justifying roi" → 2026 · "quantified and reported"
Over time, we see that those that have done some of the work to connect finance to CX grew from 24% to 34%. Around a third of the sample are at least able to show some monetization.
But the final step, putting a defensible number in front of the CFO, remains a 1-in-20 club: 4.5%, a number that has refused to grow through two name changes for the discipline and six of our reports. The 2026 question was the strictest yet — it had to be "quantified and reported" — so read the 7% to 4.5% as "no progress", not a free fall. And this is frustrating, because this cohort is getting the best results — and a real ROI.
Hover a point for the wording behind it
The Monetizers
Get Results
The companies that do monetize really win. Link your CX program to revenue data and everything changes: you can see the impact, prove the impact — and watch your best customers grow.
Hover a pair for the detail behind it
What Monetization Looks Like
When It's Real
A leading beverage bottler in Asia — a CustomerGauge customer — linked more than 42,000 survey responses across nearly 39,000 B2B accounts to revenue verified against its own financial system. The result:
 Customer Case Study
≈ +1 point of 3-year revenue growth
This is what the 4.5% can do: put a currency figure on a rescued account, and defend the CX budget with the CFO's own numbers.
Flying Blind
Nearly half of companies get a response rate of under
40% of programs get a response rate of 10% or less, which means they have no clue about 90% of their accounts. Another shocking stat.
And the feedback that does arrive covers an unknown share of the business: 60% don't know their revenue coverage, and 12.5% don't know their own company's NPS.
Survey Response Rate · Share of Programs · 2026
Bands may not sum to 100% due to rounding.
Hover a bar for the detail behind it
An Easy Win: Set a Target · Share Achieving >20% Response
The companies that set targets do better — it's that simple. Setting the number is free; hitting it becomes culture.
We have replicated this finding in three editions across ten years — and 2021 confirmed it directionally; see the decade ↓
Closing the Loop on Time
Is Becoming the Norm
close the loop within 48 hours. A positive trend: we've shown across a decade of these reports that getting back to customers fast, even just to acknowledge feedback, drives NPS up. Now the two-day turnaround, backed by an SLA, is close to standard practice.
That said, there is plenty still to do. Only 21% close the loop at every level of their customers' organisations, which means blind spots inside the account. And the outer loop, turning feedback into strategic change, remains open ground: 35% have yet to get into it at all.
The State of the Loop · 2026
Hover a bar for the detail behind it
The Benchmarking Paradox
CX leaders rate the importance of benchmarking at 8.5 out of 10 on average — and a perfect 10 was the single most common answer. Yet one in five doesn't benchmark at all, and only 16% use a third-party provider. The rest compare against generic industry reports, or their own history. Everyone wants to know "is my number good?" Almost no one has a rigorous way to answer it.
Hover a number for the detail behind it
NPS Has Gone Public
Companies used to treat NPS like a trade secret. Not anymore. CustomerGauge's NPS Intelligence Database tracks 7,100+ canonical public NPS disclosures from 3,500+ companies (2013–today), harvested from annual reports, earnings calls, press releases and news.
Public NPS Disclosures per Year
Projection: straight run-rate from 22 July; likely 1,700–1,900 allowing for earnings-season clustering. Candour note: part of the multi-year rise reflects our harvester improving as well as more companies disclosing. Data: CustomerGauge NPS Intelligence Database.
On the run rate, the year lands around 1,800 disclosures, roughly +73% and three times the volume of 2023. NPS has moved from internal dashboard to earnings-call talking point.
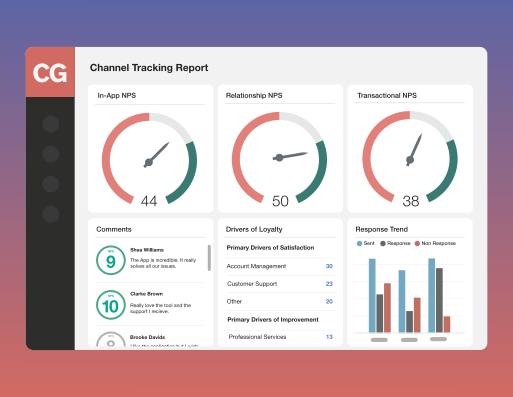
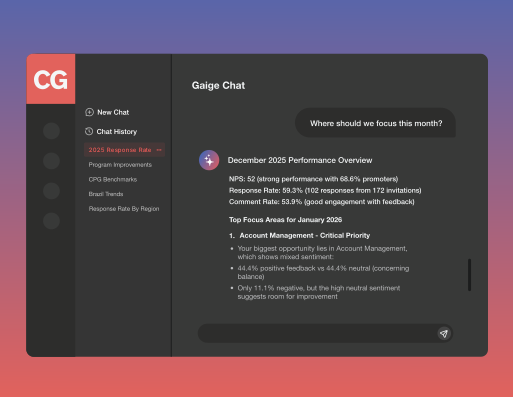
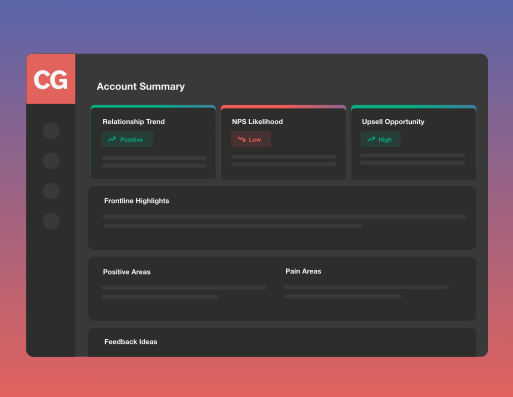
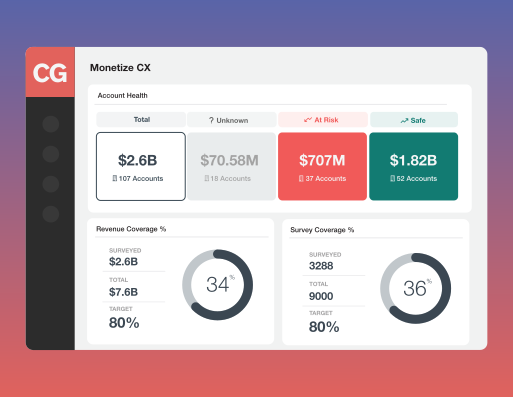
Your Account Experience team just got bigger.
Six intelligent agents, one connected system — each purpose-built for a stage of the workflow, so your program never stalls waiting for human bandwidth.
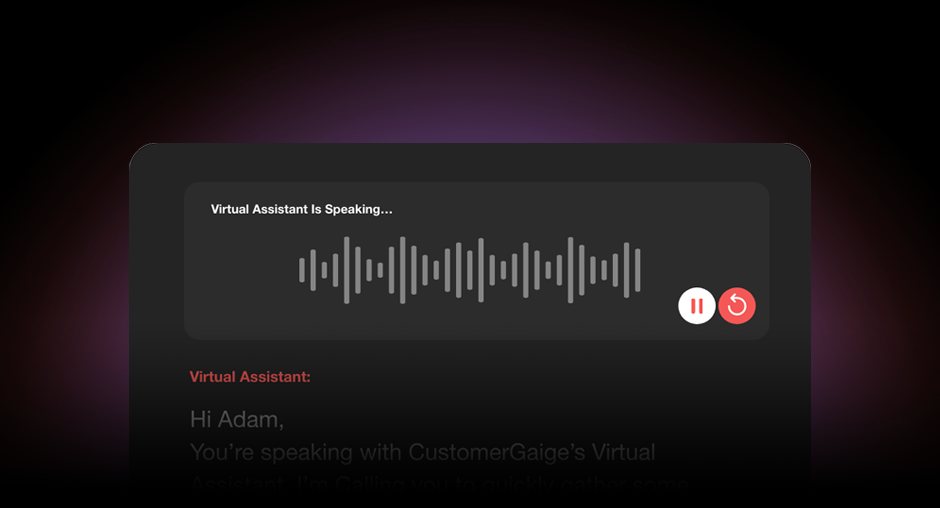
Real two-way conversations with thousands of customers at once, in 140+ languages.
Monitor every account continuously and rank who needs attention by revenue at risk.
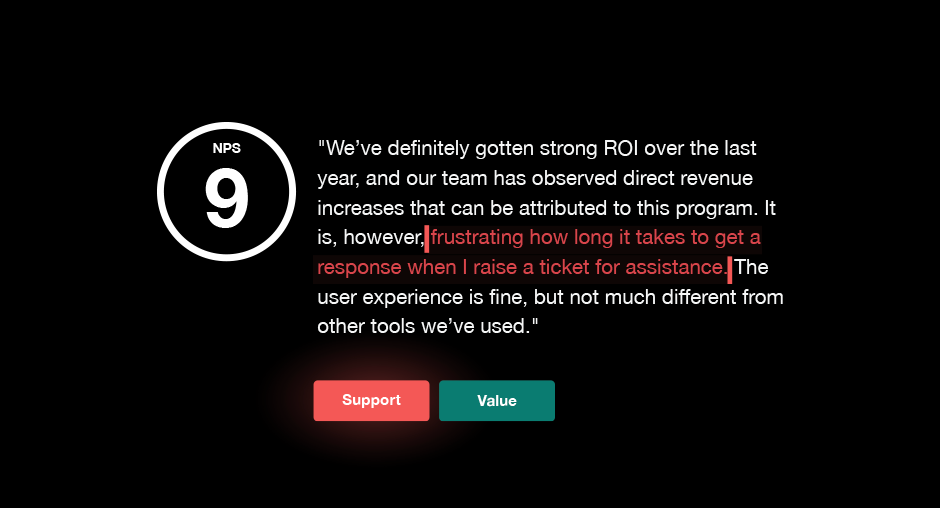
Reads every comment and surfaces the themes that actually move retention.
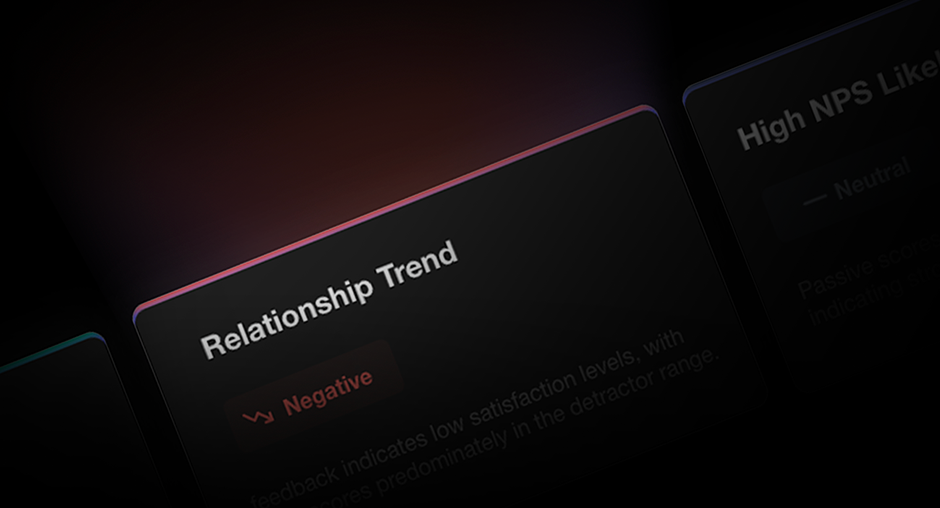
A complete view of any account’s health before a meeting — context in seconds, not hours.
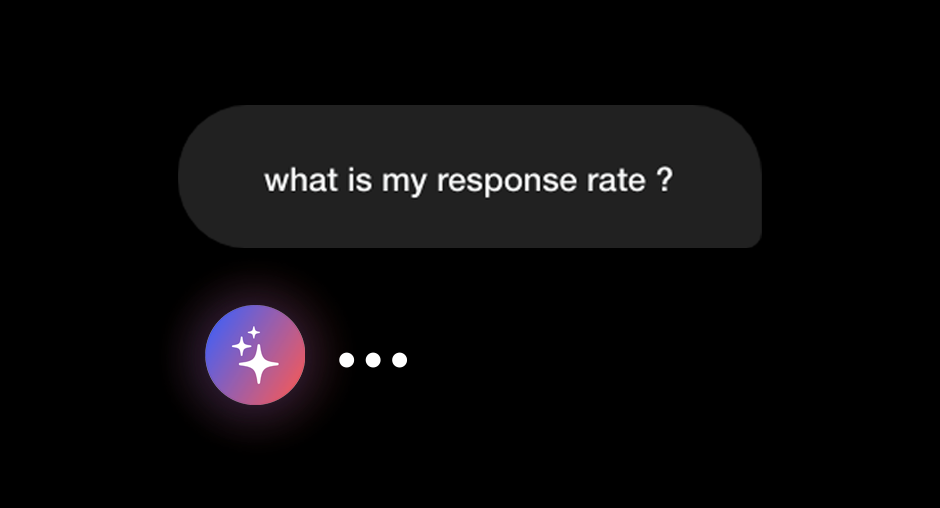
Answers questions about your customer data in plain language — just ask.
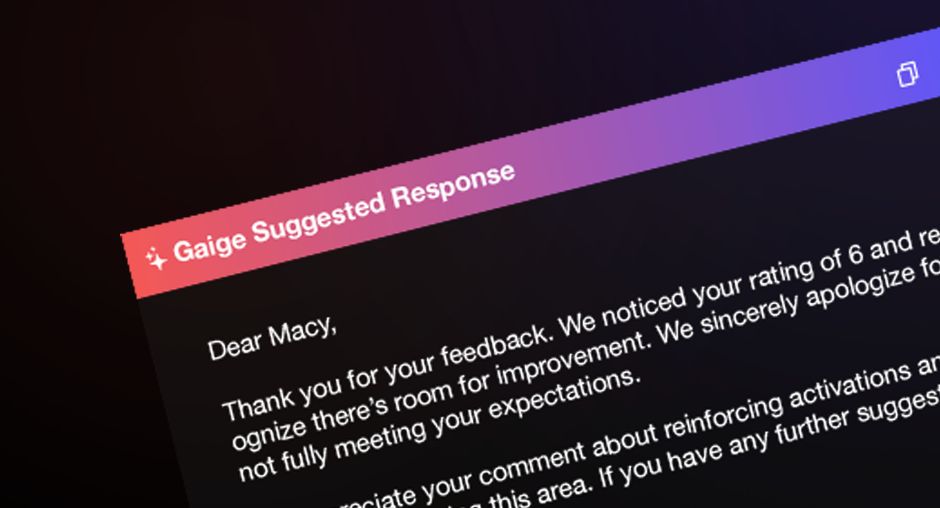
Personalized, timely follow-up on every response — before a detractor drifts toward churn.
Real customers. Real numbers.

$6M in referrals at a 47% close rate by spotting promoter accounts ready to expand.

Churn cut in half in two years with a 360° view of account health across 21 markets.

NPS up 10+ points and response rates doubled with a faster, more transparent closed loop.

Coca-Cola HBC reaches 36× more customers than with their previous CX provider.


A 99% response rate and a 16-point NPS jump turned feedback into 17% revenue growth.


Promoters spend 2× more than detractors across 100 branches — with 100% follow-up on every detractor.

AB InBev runs always-on, multi-channel feedback across 27+ markets — tuned market by market.


Briggs closes the loop on 100% of feedback — the Account Experience Award's top closed-loop rate three years running.

NPS by Sector:
The Decade Benchmark
One blended NPS per sector, averaged across every benchmark edition we have published since 2017 — thousands of programs, all measured on the same self-reported lens. Response rates are from the 2026 survey.
| sector | nps · 2026 (survey) | nps score (blended · 2017–2026) | median response rate band | |
|---|---|---|---|---|
| healthcare | 65 * | 63 | 11–20% | |
| business services & consulting | 54 | 55 | 21–35% | |
| manufacturing / industrial | 44 | 49 | 5–10% | |
| retail / consumer products | 42 | 48 | 11–20% | |
| software / technology | 51 | 47 | 11–20% | |
| financial services | 60 | 46 | 11–20% | |
| transportation / logistics | 48 | 45 | 11–20% | |
| telecommunications | 54 | 34 | 11–20% | |
| all sectors | 52 | 48 | 11–20% |
Blended NPS: simple average of every sector-level benchmark across our editions — the 2017 Benchmark Series, 2017/18 (with MIT CISR), 2021, 2023 CPG, 2025, and the 2026 survey. All self-reported on a comparable lens; adjacent categories merged where labels changed between editions (IT services + software; banking + insurance + financial services; CPG + retail). Publicly disclosed scores are excluded — they skew high. Sector samples vary by edition; treat as directional. 2026 survey column: self-reported sector medians from this edition (* healthcare: directional estimate — too few survey respondents for a reliable median). Response rates: collected in bands in the 2026 survey; the band shown is each sector's median answer. Bars: blended NPS.
How Does Your NPS
Stack Up?
Drop in your score and get a shareable benchmark card — proud moment or battle cry, it's ready to post.
Ten Years of Our Own Benchmarks
The market fixed its processes. It never connected them to money. Every chart in this section is drawn from CustomerGauge's own report archive — some 65,000 practitioner data points collected across the survey editions, plus more than a million measured responses behind the 2023 study.


seven editions, one argument: connect customer feedback to revenue. the 2026 edition is the first with client-verified financial proof. Question wording evolved between editions; decade comparisons are directional, and we say so where it matters. Data-point total assumes ~25 answers per participant per edition.
Targets Work: Replicated Across Three Editions
retention growth · 2017 edition
absolute retention · 2018 edition
response rate > 20% · 2026 edition
Hover a panel for the edition detail · each pair scaled to its own metric
Median Response Rate · Self-Reported vs Measured
Hover a point for the year's detail
The news is mixed. At a time when response feels harder to get, CustomerGauge clients are growing their response rates, with the platform median now at 19%.
Why the Market Is Failing
- ✕spam controls block unknown senders
- ✕years of unacknowledged surveys bred fatigue
- ✕long questionnaires nobody finishes
- ✕one contact asked, once a year
The CustomerGauge Playbook
- →targets on sending — drives the right engagement behaviour
- →fast loop-closing — shows you listen, teaches them to respond
- →short surveys — under a minute
- →2× a year, spread out — continual engagement, not annual ambush
- →multiple contacts per account — b2b is many voices
- →mostly monetized — you know how much revenue is covered
Non-Email Feedback Is Now the Biggest Share
Twenty years of email-first B2B feedback collection ended this year, even as email volumes continue to climb in absolute terms. In 2021 this report declared "email is king" (73% collected via email). Five years later, the king is dethroned: a mark of digital transformation, and customers seem happy with it.
The contrast with belief is the story: respondents still name email as their customers' preferred channel by a wide margin, and 12% admit they don't know what their customers prefer. The market's behavior is moving faster than its assumptions.
pre-2026 points: survey-reported channel usage; dashed = trajectory. 2026 measured on CustomerGauge b2b clients.
Net Promoter Is Still
the Monopoly
Some influencers might not like NPS — but Wall Street loves it. Our participants use CSAT and CES heavily internally; when it comes to publicising results, boards only care about NPS.
The Don't-Know Epidemic
CX programs where the respondent was unable to answer basic commercial questions about their own business
A worrying stat: CX practitioners not knowing their own numbers. Is it that they can't measure, or that participants sit less senior in the business, further from the numbers? Either way, like the lack of monetization, this should trouble the industry. (2026 adds: 12.5% don't know their own NPS.)
The Loop Got Faster,
Not Wider
AI: From Nowhere
to Normal
Share of programs actively using or piloting AI in CX
2025 = actively using + fully integrated; 2026 = using + piloting; mid-2027 = those plus planned adoption within 12 months. dashed = stated intent.
How We Did This
Survey
340 B2B CX programs, 6 May – 13 July 2026. 47 questions in five sections: core collection, culture & buy-in, roi / monetize, close the loop, ai. 10,139 answered data points. Deep-program questions answered by ~200–230; percentages are of those who answered. Respondents: 58% director-level or above, 40+ countries, 64% pure B2B.
Disclosure Lens
CustomerGauge NPS Intelligence Database: thousands of public NPS disclosures across 3,500+ companies, refreshed continuously from news, earnings and investor materials.
Platform Lens
Anonymized, aggregated benchmarks measured on the CustomerGauge platform, including one deep client case with revenue verified against source financial systems.
Archive Lens
Six prior CustomerGauge benchmark reports, 2017–2025. Question wording evolved between editions; decade comparisons are directional.
Read Honestly
Self-reported NPS is collected in bands and skews optimistic; cross-tabs are correlations, not proven causation; the sample skews toward companies already interested in CX; true market averages are likely worse.
Here's What's Next

The Deep-Dive, on the AX Podcast
The people behind these numbers sit down on The Account Experience Podcast to unpack what a decade of benchmarks means for your program.
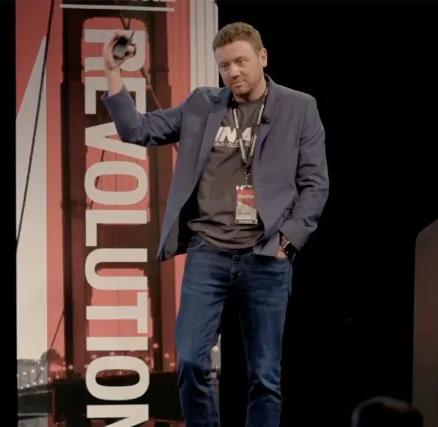
 Adam Dorrell
CEO & Co-Founder
 Camilla Scholten
COO & Co-Founder
The Raw Numbers
The dataset behind this report — every answer, anonymized — released so you can run your own analysis and check ours.
10,139 answered data points
Get a Demo
of CustomerGauge.
You've seen where the industry stands. Now see where your program stands — live, on your own accounts, with the platform the top of this benchmark already runs.